Balance Sheet (consolidated)
(KRW million)
|
2022 |
2023 |
2024 |
| Current assets |
288,113 |
298,301 |
309,605 |
| Non-current assets |
299,073 |
292,313 |
309,710 |
| Total assets |
587,186
|
590,614
|
619,315
|
| Current debt |
225,145 |
214,189 |
259,276 |
| Non-current debt |
62,316 |
67,371 |
30,428 |
| Total debt |
287,461
|
281,560
|
289,704
|
| Capital from owner of parent company |
298,524 |
308,308 |
326,838 |
| Capital |
13,602 |
13,602 |
13,602 |
| Other paid-in capital |
9,470 |
8,990 |
17,623 |
| Other components of capital |
767 |
998 |
5,299 |
| Retained earnings |
274,685 |
284,718 |
290,314 |
| Non-controlling interest |
1,201 |
746 |
2,773 |
| Total capital |
299,725
|
309,054
|
329,611
|
Income statements(consolidated)
(KRW million)
|
2022 |
2023 |
2024 |
| Sales revenue |
646,040 |
631,382 |
628,348 |
| Cost of sales |
525,920 |
498,952 |
504,445 |
| Selling and administrative expenses |
100,266 |
106,603 |
104,921 |
| Operating profit |
19,854 |
25,827 |
18,982 |
| Net profit before corporate tax expenses |
10,672 |
19,134 |
21,614 |
| Net profit for current period |
5,498 |
16,131 |
15,473 |
Major financial ratios (consolidated)
|
2022 |
2023 |
2024 |
| Stability |
|
|
|
| Current ratio |
128.0% |
139.3% |
119.4% |
| Quick ratio |
83.1% |
93.7% |
79.9% |
| Debt ratio |
95.9% |
91.1% |
87.9% |
| Activity |
|
|
|
| Total Asset Turnover Ratio |
1.1 |
1.1 |
1.0 |
| Equity Turnover Ratio |
2.2 |
2.1 |
2.0 |
| Accounts Receivable Turnover Ratio |
4.4 |
4.3 |
4.4 |
| Profitability |
|
|
|
| ROA |
0.9% |
2.7% |
2.6% |
| ROE |
1.8% |
5.3% |
4.8% |
| Net Profit Margin on Sales |
0.9% |
2.6% |
2.5% |
| Growth |
|
|
|
| Sales Growth Rate |
2.3% |
-2.3% |
-0.5% |
| Net Profit Growth Rate |
-326.7% |
193.4% |
-4.1% |
| Stock-related Ratios |
|
|
|
| EPS |
237 |
685 |
654 |
| PER |
24.8 |
9.7 |
9.4 |
Balance Sheet (standalone)
(KRW million)
|
2022 |
2023 |
2024 |
| Current assets |
234,318 |
251,392 |
252,630 |
| Non-current assets |
279,127 |
272,922 |
290,877 |
| Total assets |
513,445
|
524,314
|
543,507
|
| Current debt |
201,926 |
180,496 |
224,017 |
| Non-current debt |
48,537 |
66,573 |
28,026 |
| Total debt |
250,463
|
247,069
|
252,043
|
| Capital |
13,602 |
13,602 |
13,602 |
| Other paid-in capital |
10,184 |
9,704 |
18,347 |
| Other components of capital |
-911 |
-567 |
-450 |
| Retained earnings |
240,107 |
254,506 |
259,965 |
| Total capital |
262,982
|
277,245
|
291,464
|
Income statements (standalone)
(KRW million)
|
2022 |
2023 |
2024 |
| Sales revenue |
552,352 |
558,978 |
555,601 |
| Cost of sales |
460,015 |
446,443 |
450,047 |
| Selling and administrative expenses |
80,289 |
86,945 |
87,547 |
| Operating profit |
12,048 |
25,590 |
18,007 |
| Net profit before corporate tax expenses |
6,739 |
23,192 |
20,062 |
| Net profit for current period |
5,124 |
20,528 |
15,328 |
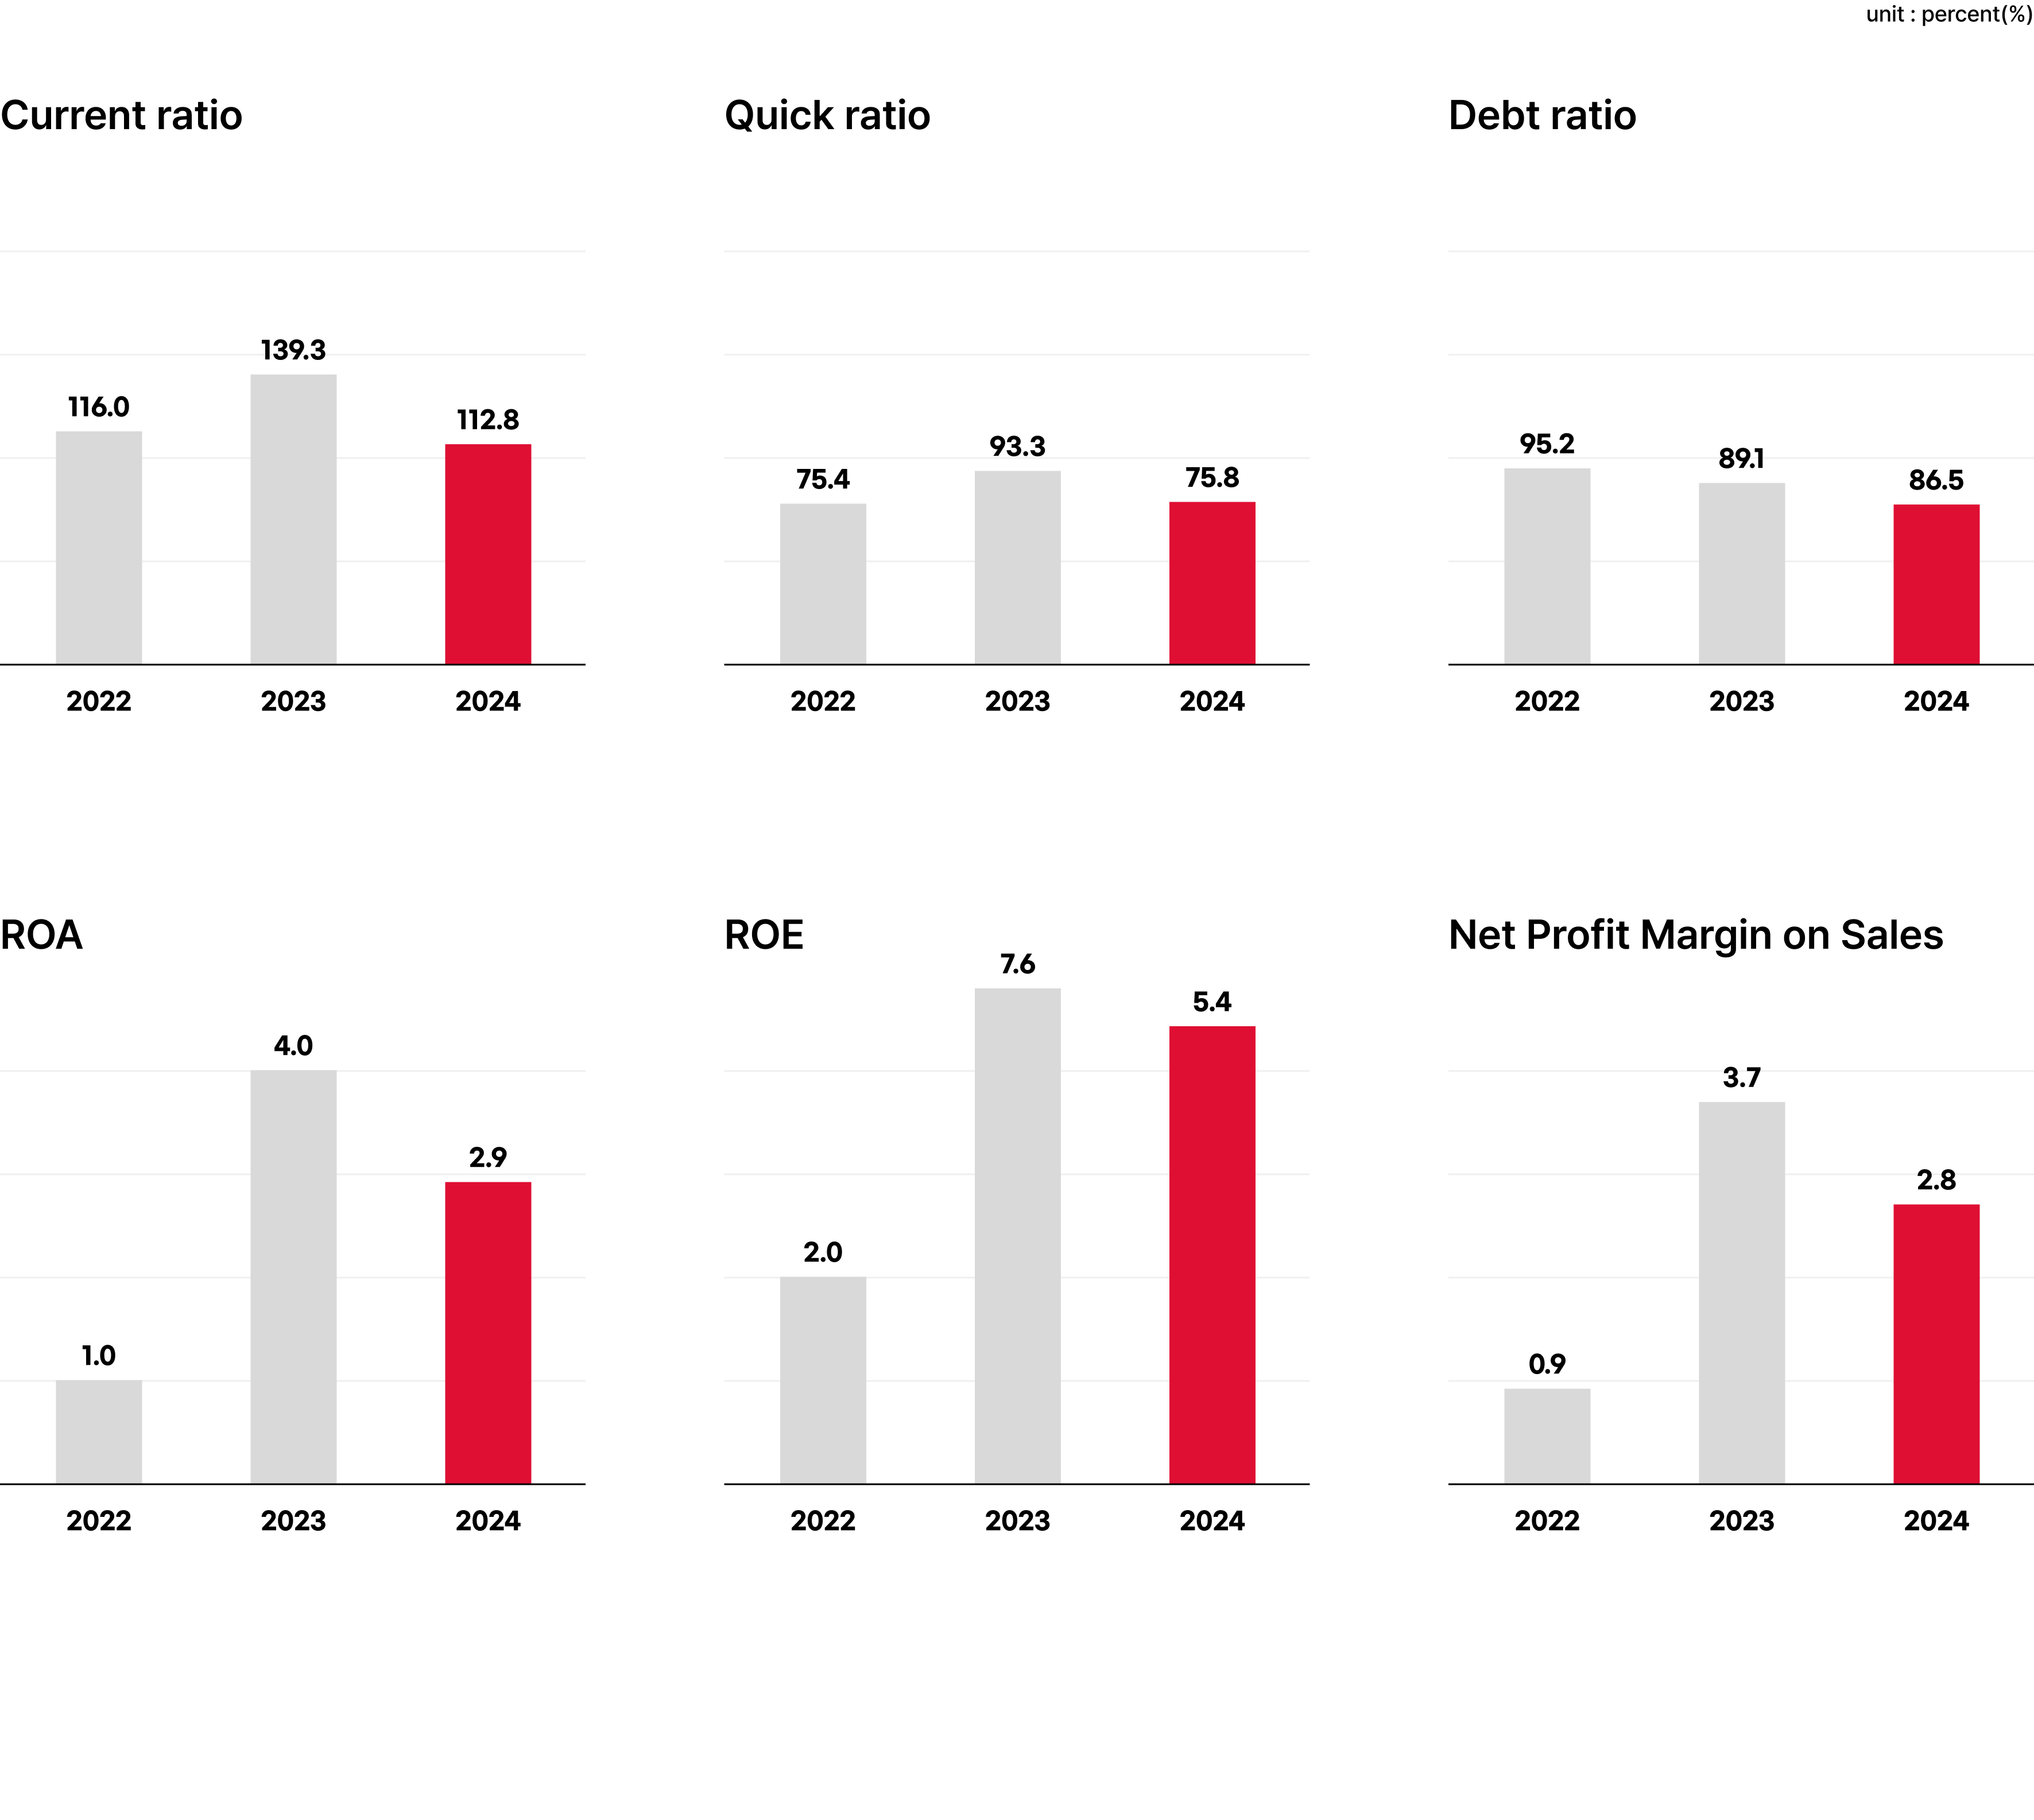
Major financial ratios (standalone)
|
2022 |
2023 |
2024 |
| Stability |
|
|
|
| Current ratio |
116.0% |
139.3% |
112.8% |
| Quick ratio |
75.4% |
93.3% |
75.8% |
| Debt ratio |
95.2% |
89.1% |
86.5% |
| Activity |
|
|
|
| Total Asset Turnover Ratio |
1.1 |
1.1 |
1.0 |
| Equity Turnover Ratio |
2.1 |
2.1 |
2.0 |
| Accounts Receivable Turnover Ratio |
4.4 |
4.4 |
4.4 |
| Profitability |
|
|
|
| ROA |
1.0% |
4.0% |
2.9% |
| ROE |
2.0% |
7.6% |
5.4% |
| Net Profit Margin on Sales |
0.9% |
3.7% |
2.8% |
| Growth |
|
|
|
| Sales Growth Rate |
1.4% |
1.2% |
-0.6% |
| Net Profit Growth Rate |
-176.6% |
300.6% |
-25.3% |
| Stock-related Ratios |
|
|
|
| EPS |
217 |
870 |
648 |
| PER |
27.1 |
7.6 |
9.5 |
 Wall paint
친환경 벽지 페인트
Wall paint
친환경 벽지 페인트